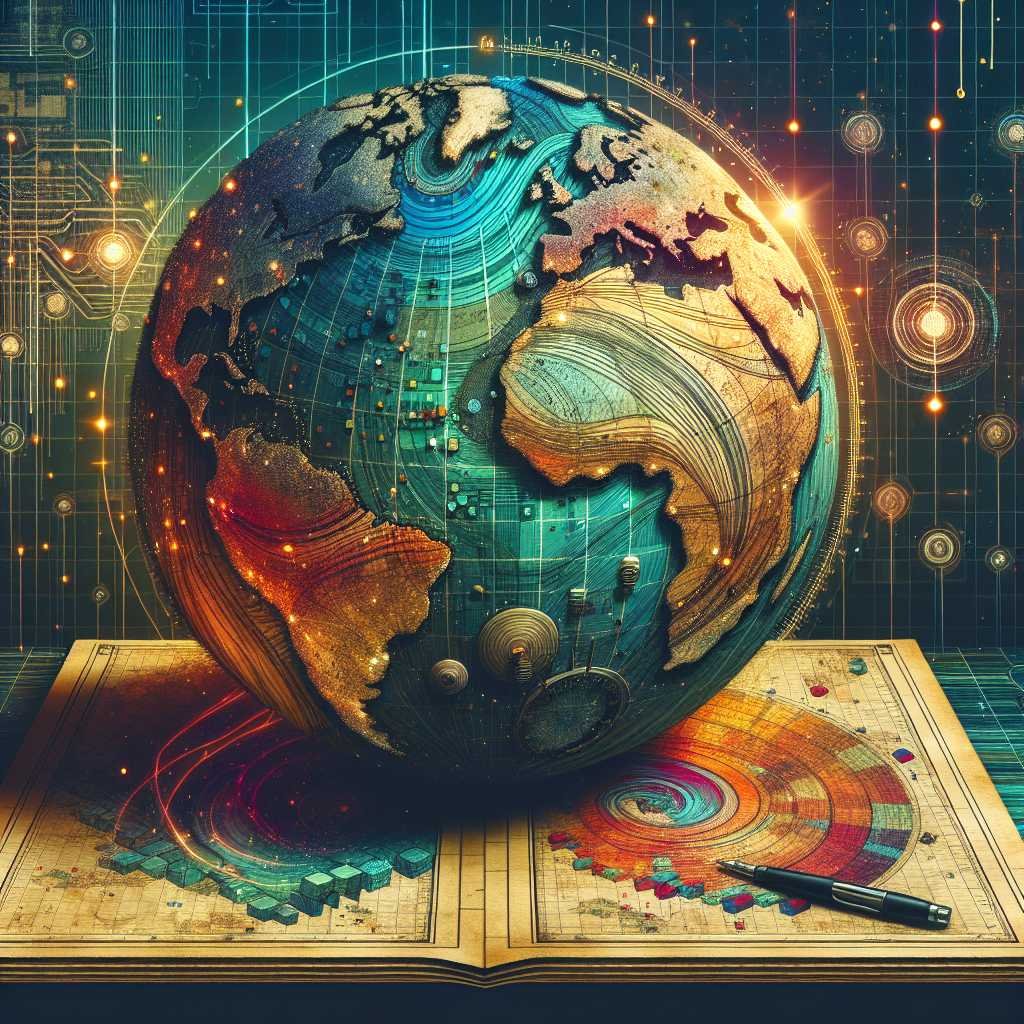
A World of Maps: Unraveling the Art and Science of Geographic Information Systems (A Beginner-to-Expert Guide)
Ever stared at a beautiful map and wondered, “How did they make this—and what hidden stories is it telling?” That spark of curiosity is exactly how geospatial journeys begin. Whether you’re a student, an analyst, a city planner, or a curious map lover, this guide will help you see the world the way GIS professionals do: through patterns, relationships, and spatial context.
By the end, you’ll understand how data becomes insight, how projections can stretch your perception, and how spatial analysis helps answer complex questions—from “Where should a new clinic go?” to “Which neighborhoods are most vulnerable to flooding?” You’ll also learn which tools to use, how to choose the right specs, and how to build your first map with confidence.
From Clay Tablets to Cloud Tiles: A brief history of cartography
Maps are among humanity’s oldest storytelling tools. Early maps carved on clay and painted on parchment showed trade routes, sacred sites, and coastlines. Over centuries, cartography evolved with printing, navigation, and science. The Age of Exploration fueled the need for precise charts, while the 20th century ushered in aerial photography and satellites.
Then the internet changed everything. Web maps moved from static images to interactive, tiled layers that load instantly on phones and browsers. Today, you can overlay demographics on imagery, trace supply chains, and monitor wildfires in near real time. For a quick primer on cartography’s evolution, check out resources from National Geographic.
Here’s why that matters: when you understand how mapping evolved, you’re better prepared to choose the right approach for modern problems. And in GIS, choosing the right approach is half the battle.
The science behind maps: projections, coordinates, and clarity
Flattening the Earth onto a screen is a magic trick with trade-offs. Imagine peeling an orange and trying to lay the peel flat—something has to stretch, tear, or shrink. Map projections decide what gets preserved: area, shape, distance, or direction.
- Web Mercator is everywhere (think online basemaps), but it distorts area near the poles.
- Equal-area projections (like Albers) preserve area, ideal for thematic maps.
- UTM divides the world into zones for accurate distance measurements at local scales.
If you’re mapping global phenomena, think equal-area; for street-level routing, think projected systems like UTM. The U.S. USGS and NOAA’s NGS have excellent explainers on projections and datums like WGS84.
Coordinate systems tell GIS where features live on Earth. The EPSG registry catalogs thousands of them—check specifics at the EPSG database. The right coordinate system ensures layers line up, buffers make sense, and measurements are meaningful. Pro tip: if layers don’t align, check their coordinate reference systems and on-the-fly reprojection settings first.
Symbology, scale, and legends turn complexity into clarity: – Use size, color, and opacity to guide the eye to what matters. – Keep labels legible; avoid clutter. – Match your legend to your audience—simple beats clever.
Geographic data 101: sources, formats, and quality that you can trust
GIS runs on data—the better the data, the better the map. You’ll work with two main types: – Vector (points, lines, polygons) for features like addresses, roads, and parcels. – Raster (grids) for imagery, elevation, temperature, and continuous surfaces.
Where data comes from: – Traditional surveys and GNSS (GPS) for high-accuracy points. – Remote sensing, including satellites (e.g., USGS Earth Explorer, Copernicus Sentinel) and aerial imagery. – Community-sourced data like OpenStreetMap. – Government portals (census, environment, transportation) and open data catalogs.
Formats you’ll meet: – Shapefile (legacy, common, but limited), GeoPackage (modern, single-file), and GeoJSON (web-friendly). – GeoTIFF and Cloud Optimized GeoTIFF for rasters; NetCDF for multidimensional data. – Databases like PostGIS for scalable, multiuser editing.
Data quality isn’t optional. Check: – Accuracy (how close to the truth), precision (consistency), completeness, timeliness, and metadata. – Lineage: who created it, when, how, and why. – Standards: look for OGC compliance and robust metadata.
If you’re just getting started, a beginner-friendly GIS workbook and a basic GPS receiver can make learning faster—Shop on Amazon.
Inside a GIS: hardware, software, and the data layer cake
Think of GIS as a three-part system: 1) Hardware: your workstation, GPU, storage, and sometimes field devices. 2) Software: desktop, web, and mobile tools to view, edit, analyze, and share. 3) Data: the geospatial layers, services, and databases that power your maps.
Popular software options: – Open source: QGIS, PostGIS, GDAL. Flexible, extensible, and budget-friendly. – Commercial: ArcGIS Pro and ArcGIS Online. Deep toolsets, enterprise integration, and support.
Cloud GIS is now standard. You’ll publish services (WMS/WFS/WMTS), stream live feeds (IoT, GPS pings), and scale analysis in the cloud. Many teams mix open-source stacks with commercial platforms based on project needs.
When deciding between platforms, consider your budget, the complexity of analysis, collaboration needs, and long-term support. Before you pick software or a laptop, compare specs and bundles side by side—Check it on Amazon.
How GIS stores reality: data models and structure
GIS simplifies the world so we can analyze it: – Vector models handle discrete features. Topology rules (no dangling roads, polygons that close) keep data clean. – Raster models handle continuous surfaces. Cell size (resolution) determines detail and performance. – TINs model terrain with triangles for accuracy in 3D analyses. – Networks add connectivity (roads, pipes, power lines) for routing and flow modeling.
Storage matters. File-based geodatabases and GeoPackage keep projects portable. Enterprise databases scale to teams and multi-gigabyte datasets. For web delivery, tiles and pyramids speed up maps without sacrificing detail.
Spatial analysis and reasoning: turning layers into answers
Here’s where GIS shines—finding patterns and making decisions.
Core techniques: – Proximity and overlay: buffers, intersects, unions, and spatial joins help you find what’s near what and how layers interact. – Network analysis: shortest path, service areas, and routing optimize travel time and logistics. – Terrain analysis: slope, aspect, viewshed, and watershed analyses model how water, visibility, and gravity behave. – Geostatistics: interpolation and kriging estimate values between points—handy for air quality, soil, or rainfall.
Example: Need to site a new emergency clinic? Combine layers: population density, travel time, past incident locations, flood risk, and public transit. Weight each criterion, run a suitability analysis, and map the top candidate areas. Tools like Esri’s spatial analysis and open-source equivalents in QGIS make this accessible.
If you want to experiment with field mapping kits and GNSS accessories, See price on Amazon.
Real-world applications: how industries use GIS today
GIS isn’t just for map nerds—it’s embedded in critical decisions across sectors.
Urban planning and smart cities: – Site selection, zoning, and equity mapping. – Traffic flow, transit planning, and pedestrian safety.
Environment and natural resources: – Habitat suitability, migration corridors, and conservation planning. – Wildfire risk mapping and post-burn assessments using satellite imagery.
Transportation and logistics: – Routing, last-mile delivery, and fleet tracking. – Network resilience and alternative routing during disruptions.
Public health: – Outbreak mapping, vaccination coverage, and social vulnerability analysis. – Agencies like the WHO use geospatial insights to allocate resources where they matter most.
Business and retail: – Trade area analysis, customer segmentation by location, and competitor mapping. – Real estate comps and market potential modeling.
Humanitarian and disaster response: – Rapid damage assessments after storms or earthquakes. – Coordination via situational awareness dashboards from groups like UN OCHA.
Each of these use cases shares a pattern: combine trustworthy data, pick the right projection, apply the right analysis, and communicate results clearly to non-experts.
Build your first GIS project: a quick roadmap
Want a simple, practical path? Try this:
1) Choose a question. Example: “Where should our city add cooling centers for heat waves?” 2) Collect data. Census demographics, heat index rasters, transit stops, hospital locations, and parks. Sources like NASA Earthdata help with climate and environmental layers. 3) Set a suitable projection. For a city or region, UTM or a local state plane is often best. 4) Clean and document. Fix invalid geometries, check metadata, and standardize fields. 5) Analyze. Create buffers around transit, intersect with high heat and high population density, weight criteria, and map candidate sites. 6) Style and share. Use clear symbology, label sparingly, write a concise legend, and include a one-paragraph methods note.
Ready to upgrade your setup with an external SSD or a 4K monitor for cartography—Buy on Amazon.
Pro tip: Always include a short “assumptions and limitations” note. It builds trust and helps others interpret the map responsibly.
The future of GIS: AI, big data, and ethics
The next frontier is huge—and exciting: – Cloud-native geospatial: Cloud Optimized GeoTIFFs (COGs) and GeoParquet streamline massive datasets. – AI + GIS: land-cover classification, object detection in imagery, and predictive modeling for infrastructure or disease spread. – Planet-scale analysis: platforms like Google Earth Engine and Microsoft Planetary Computer let you analyze decades of imagery in minutes. – Mobile and AR: from field data capture to in-situ visualization and indoor mapping.
With power comes responsibility. Location data can be sensitive. Privacy laws like GDPR set guardrails, but ethics go beyond compliance. Ask: Do people know how their location data is used? Could my model unintentionally reinforce bias? Am I transparent about uncertainty?
Choosing tools, specs, and buying tips for a smooth GIS workflow
If you’re building or upgrading your GIS toolkit, match your gear to your workloads.
Workstation or laptop: – CPU: 6+ cores for faster processing and multitasking. – RAM: 32 GB for comfortable desktop work; 64 GB for heavy rasters or virtualization. – GPU: midrange discrete GPU for 3D scenes and rendering. – Storage: NVMe SSD; keep a separate fast drive for data and caches. – Display: color-accurate monitor, ideally QHD or 4K for dense map content.
Field gear: – GNSS: sub-meter receivers for asset inventory; RTK for survey-grade. – Drones: check local regulations, camera sensor size, and flight time. – Mobile: rugged devices or cases, long-life batteries, and offline maps.
Data hygiene and backups: – Version your projects. – Use naming conventions and metadata templates. – Keep at least two backups—onsite and cloud.
Software considerations: – ArcGIS Pro for deep enterprise integration and advanced tools. – QGIS for open-source flexibility and powerful plugins. – PostGIS for multiuser editing and geospatial SQL at scale. – Don’t forget converters like GDAL for format wrangling.
Before you lock in your hardware basket, spec a machine for your raster sizes, storage needs, and GPU acceleration—and stress test with sample data. For vetted books, GNSS gear, and compatible drones, you can View on Amazon.
Buying checklist: – Define your must-haves (accuracy, speed, portability) and nice-to-haves. – Map your typical project sizes (e.g., 10 GB imagery vs. 500 GB mosaics). – Test a trial project on candidate hardware if possible. – Plan for training: budget time and courses, not just tools.
Compare accessories and bundles that pair well with your core tools—external SSDs, calibration targets, and ergonomic peripherals can boost real-world productivity. If you’re comparing field kits or laptop configurations, it helps to see current pricing and reviews in one place—Check it on Amazon.
Common pitfalls—and how to avoid them
- Ignoring projection mismatches: fix CRS issues first to avoid nonsense measurements.
- Over-styling: prioritize readability; maps are not Christmas trees.
- Data hoarding: curate what’s relevant; archive the rest to keep projects nimble.
- Skipping metadata: future you (and your teammates) will thank you.
- Treating GIS as “just a map”: it’s a decision system—document methods and uncertainty.
If you’re unsure about field sensors or starter kits, vet user reviews, sample data quality, and accessory compatibility before you buy—See price on Amazon.
FAQ: quick answers to common GIS questions
Q: What is GIS, in simple terms? A: GIS is a system for capturing, storing, analyzing, and visualizing data by location. It helps you answer “where” and “why” questions by layering data and running spatial analyses.
Q: What’s the difference between a map and GIS? A: A map is an output (a visualization). GIS is the engine that stores data, runs analysis, and produces maps or dashboards you can explore interactively.
Q: Which projection should I use? A: It depends on your goal and extent. For local city projects, a local projected CRS like UTM or State Plane is common. For national thematic maps, pick an equal-area projection. Always document your choice.
Q: Is QGIS as good as ArcGIS Pro? A: Both are excellent. QGIS shines for open-source workflows, customization, and cost-effectiveness. ArcGIS Pro offers integrated enterprise tools, specialized extensions, and managed services. Many teams use both.
Q: How accurate is GPS on a phone? A: Typically 3–10 meters in open sky. For sub-meter or centimeter accuracy, use dedicated GNSS receivers, differential corrections (SBAS/RTK), and good field practices.
Q: How do I learn GIS fast? A: Start with a clear question, then practice on a small project end to end. Use open data, watch a focused tutorial, and build muscle memory with common tasks: joins, buffers, projections, and styling.
Q: What careers use GIS? A: Urban planning, environmental consulting, utilities, logistics, public health, emergency management, retail analytics, and more. Roles range from GIS analyst and developer to cartographer and data scientist.
The takeaway
Maps are more than pictures; they’re arguments backed by data. With a grasp of projections, data quality, and analysis, you can turn raw layers into insight that informs real decisions. Start small, be clear about methods, and keep learning—this field rewards curiosity. If you found this helpful, stick around: we’ll keep sharing practical guides, real-world examples, and bite-size tutorials to level up your geospatial skills.
Discover more at InnoVirtuoso.com
I would love some feedback on my writing so if you have any, please don’t hesitate to leave a comment around here or in any platforms that is convenient for you.
For more on tech and other topics, explore InnoVirtuoso.com anytime. Subscribe to my newsletter and join our growing community—we’ll create something magical together. I promise, it’ll never be boring!
Stay updated with the latest news—subscribe to our newsletter today!
Thank you all—wishing you an amazing day ahead!
Read more related Articles at InnoVirtuoso
- How to Completely Turn Off Google AI on Your Android Phone
- The Best AI Jokes of the Month: February Edition
- Introducing SpoofDPI: Bypassing Deep Packet Inspection
- Getting Started with shadps4: Your Guide to the PlayStation 4 Emulator
- Sophos Pricing in 2025: A Guide to Intercept X Endpoint Protection
- The Essential Requirements for Augmented Reality: A Comprehensive Guide
- Harvard: A Legacy of Achievements and a Path Towards the Future
- Unlocking the Secrets of Prompt Engineering: 5 Must-Read Books That Will Revolutionize You